
Select Company
A summary of the fifth chapter of You Don't Know What You're M ss ng

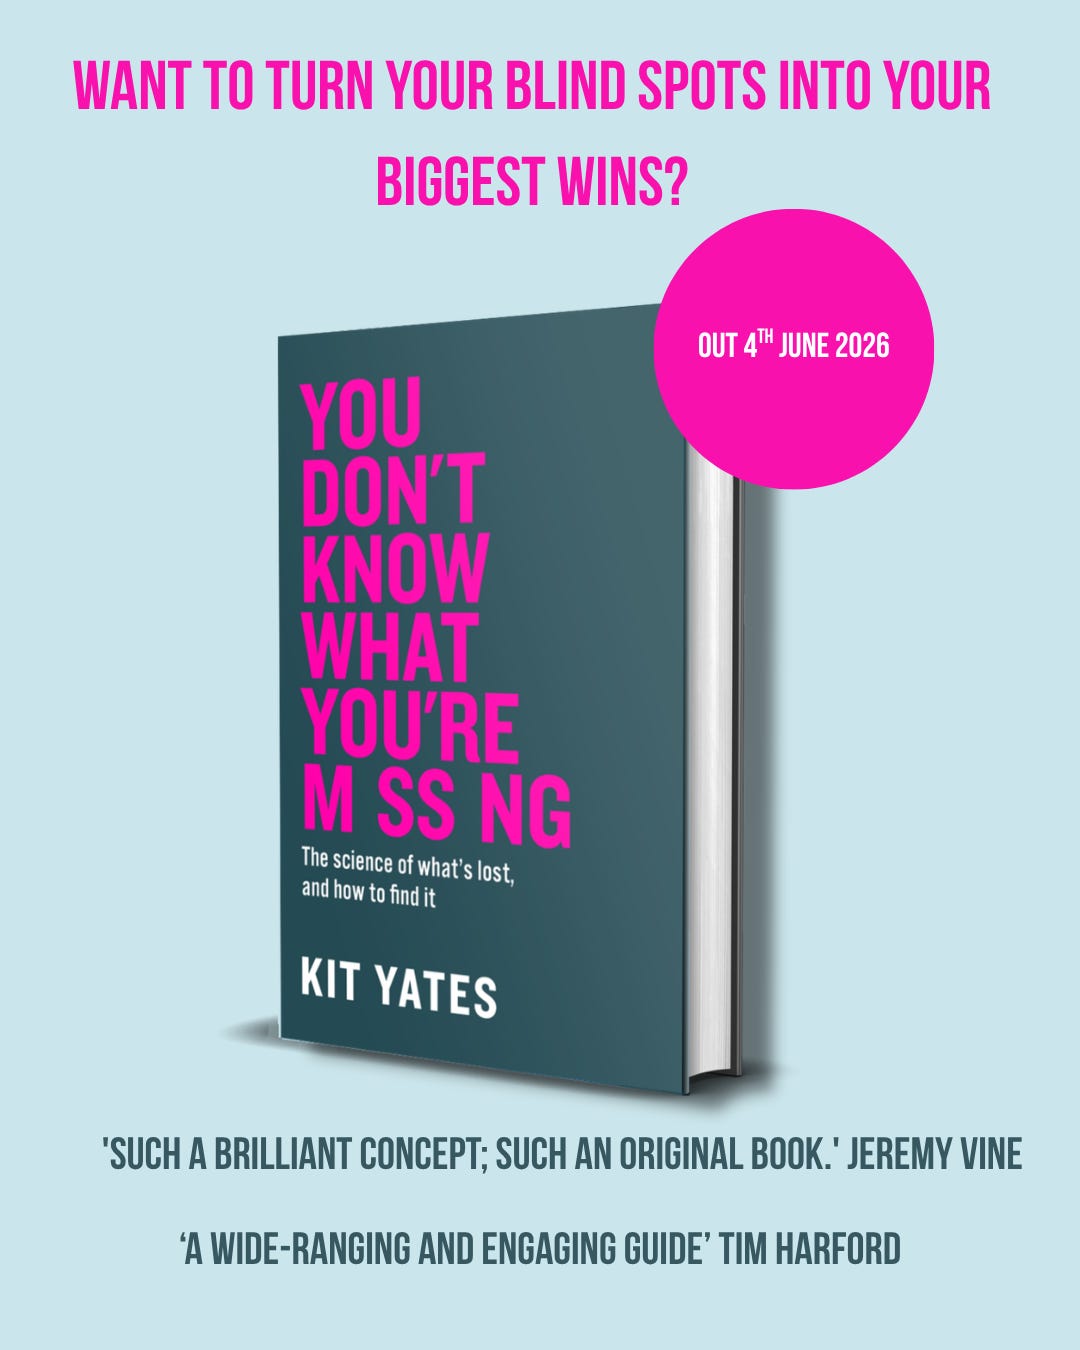
We’re now into the second half of the short series of posts I’m writing for this Substack, summarising the chapters of my new book, You Don’t Know What You’re M ss ng. Publication is under two weeks away on the 4th June. As before with these summaries, the aim is to give you a feel for the shape of the argument, the kinds of stories I use in the book to get the message across, and the ideas I hope will stick with you long after you’ve finished reading it.
In this post I’m going to summarise Chapter 5, Select Company.
“The greatest obstacle to discovery is not ignorance - it is the illusion of knowledge.” Daniel J. Boorstin, American historian.
“A QUARTER of students catch an STI during their first year at university - and half are too drunk to remember who gave it to them.”
So read a headline in the Daily Mail in October 2013. Timed to coincide with the first couple of weeks of a new university year, the article brought a number of questions immediately to my mind; prosaically and perhaps indicative of my mathematically preoccupied mindset, the most pressing one was ‘How had the headline statistics been gathered?’
The answer, it turned out, was not a university-led study, or a medical survey, or anything you would reasonably call research. The figures came from a self-selected poll of the subscribers to a dating website - ShagAtUni.com - whose “sole purpose”, in their own words, “is to help students meet up for sex”.
You don’t need to be a statistician to see the problem. If you only ask the people most likely to have lots of sexual partners, and you exclude people in stable relationships, you are going to get a very skewed picture of student sexual health. Whole groups are missing before you even begin.
That is the central idea of this chapter: we can end up making mistakes, not because we have missed something in our own reasoning, but because the information we’re reasoning from has already been filtered. Something is missing by the time it reaches us. In the book I call this extrinsic missingness: missingness in which important data is removed from view by some external process before it is even set in front of us, so our view is partially blocked and we are not seeing the full picture.
Surveys are common places where extrinsic missingness is perhaps most readily found, because surveys come with a built-in illusion of objectivity: there is a number; it looks precise; it feels scientific. But surveys go wrong in predictable ways, and this chapter is, in large part, a guide to those predictable failures.
One obvious issue is representativeness. Even if every respondent answered perfectly honestly, you can still be wrong if the group you asked isn’t representative of the population you’re trying to talk about. And you can also be wrong simply because you didn’t ask enough people. If the true preference between two options is 52:48, small samples will often tell you the wrong answer, purely through randomness. Even at sample sizes that feel large, close-run things (like the Brexit referendum) are hard to call.
But the bigger, and arguably more interesting failures of surveying are the ones that don’t go away with bigger samples. Because if the method is biased, taking more data doesn’t pull you towards the truth. It pulls you more confidently towards the wrong answer.
A lot of the chapter is then about different flavours of bias that cause the wrong people to appear in your results, or cause some of the right people to disappear.
One set of problems comes from how people end up in the survey at all. There is a distinction between how you choose the sample and who ends up in the results. Even if you start with a decent sampling plan, you can still end up with skewed outcomes through non-response, drop-out, missing data, and all the other ways people can vanish from the final dataset.
A prominent example of overrepresentation was recently illustrated in a BBC headline about chronic traumatic encephalopathy (CTE) in NFL players: “Brain disease affects 99% of NFL players in study”. The underlying study examined brains in a brain bank, many donated by families who suspected their loved one had neurological problems. That is not a random sample of players. It is a sample heavily enriched for the very thing you’re trying to measure. To their credit, the scientists who wrote the study warned against drawing population-level conclusions from this sample. But that warning is exactly the kind of nuance that is easily stripped away as results travel from paper to press release to headline.
Underrepresentation can be just as damaging. The classic cautionary tale is the 1948 US presidential election, when the Chicago Tribune printed “DEWEY DEFEATS TRUMAN” before the results were in. The call was supported by a Gallup poll that looked reliable, but had a fatal flaw: quota sampling meant interviewers had targets by demographic category (in an attempt to ensure representativeness), yet they were free to fill those quotas with whoever was easiest to find and willing to talk, which tended to miss working-class Truman voters on long shift patterns and over-represent more affluent respondents. Truman won comfortably, and the paper was immortalised in embarrassment.
One almost surefire way to create a biased sample is to let it pick itself. Open-access surveys are cheap, quick, and often completely unrepresentative. People who respond tend to be those with the strongest views, the most time, or the biggest grievance. This creates a familiar distortion: the moderate majority goes missing and the extremes dominate.
HOPE not hate’s “National Conversation on Immigration” report illustrates the point neatly. The same question (“On a scale of 1–10, with 1 very negative and 10 very positive, do you feel that immigration has had a positive or negative impact on the UK, including your local area?”) was asked in two ways: an open online survey and a nationally representative poll. In the open survey, responses clustered at the extremes. In the representative poll, far fewer people held the most extreme views. Changing the sampling method made people with differing views become more or less visible.
And even when you try to correct for missingness, you can make things worse. Pollsters weight survey results to match demographic proportions, but if turnout varies strongly by demographic group, then “making your sample look like the population” can still misrepresent who will actually vote. The 2015 UK election polling miss is a cautionary tale: pollsters corrected for underrepresented younger voters (who tend to be more left-leaning), but failed to account properly for the fact these same younger demographics tend to have lower turnout. Consequently, many polls ended up with an overly optimistic picture of Labour support.
Quite apart from the question of whether your sample is representative, there is a different, more human set of issues: even if you ask the right people, they might not answer truthfully.
Sometimes people simply misreport. In a closed population over a fixed time period, heterosexual partnerships contribute one partner to the male count and one to the female count, so average reported numbers should not diverge dramatically. Yet in survey after survey, men report far more opposite-sex partners than women do. This is a big red flag that responses are not purely measuring behaviour, but are also affected by the truthfulness (or otherwise) of the respondents.
And beyond misremembering, there are predictable psychological pressures. People say what they think is expected of them. They say what makes them look good. They say what avoids embarrassment. They say what they think people want to hear. Surveys can suffer from acquiescence bias, courtesy bias, compliance or coercion, demand effects, and social desirability bias. In authoritarian settings, “approval ratings” can be meaningless because dissent is dangerous. In less extreme settings, people still tweak their answers towards what feels socially acceptable.
So what can you do when you want to measure something people don’t want to admit to?
You get clever about how you ask. Chapter 5 ends with an illustration of an elegant survey technique known as a randomised response trial. When trying to find out what proportion of the population practice an embarrassing or taboo habit, the idea is to introduce randomness so individual answers carry plausible deniability, while still allowing us to estimate the true prevalence of a behaviour across a whole population. The simplest version gets everyone to flip a coin: heads answer truthfully, tails answer “yes” to the embarrassing behaviour regardless. A “yes” answer becomes deniable - “the coin made me do it”. The cost is that you’ve deliberately contaminated your data with false answers. The benefit is that people can answer honestly without feeling exposed, and because we know how many default “yes” answers we expect due to people flipping a tail, we can recover an estimate of the true prevalence by working back from the overall proportion of “yes” responses.
Extrinsic missingness doesn’t just mislead us. It gives us the confidence of a number while hiding the fact that the number may have been born biased.
So the take-home message from this fifth chapter is about questioning where the statistics that are put in front of us come from. When you see an alarming statistic or a suspiciously neat survey result, your first question should be “how was this measured?” To help you answer, ask: “Who was missing?” “Who was overrepresented?” “What incentives shaped the answers?” “What might have been filtered out before the number reached you?”
A favour: pre-order the book
If you’ve enjoyed this summary, you’ll find much more detail in the book itself, with the stories, the science, and the slightly uncomfortable implications.
If the book sounds like your sort of thing, please consider pre-ordering it. Pre-orders matter far more than most readers realise. They’re one of the strongest early signals that a book has an audience, which influences everything from how many copies are stocked to how widely it’s recommended.
Amazon: https://www.amazon.co.uk/Dont-Know-What-Youre-Missing/dp/1529438039
Bookshop.org (supports independent bookshops):
https://uk.bookshop.org/p/books/you-don-t-know-what-you-re-missing-the-science-of-what-s-lost-and-how-to-find-it-kit-yates/497ab9dcf971763
Thanks,
Kit
I'm reminded of Vic Reeves's “37.8% of all statistics are made up on the spot!” 😂.
There's a programme on BBC Radio 4 (with a short, 10' version on the BBC World Service) called ‘More or Less’, hosted by Tim Harford. If you're not aware of it, I think you'd enjoy it. While it has a large UK bias (hence the shorter version on the World Service, I assume) it's a programme where people write in precisely with the kind of questions about dubious sounding statistics and the claims made based on them.
I'll have to look into your previous chapter summaries and, in all likelihood, as it to my list. It's growing a bit alarmingly, at the moment, but I have a birthday coming up in a month 😊. I'm glad you gave a link to independent bookshops. I refuse to buy anything on Amazon, least of all books. I have no desire to enrich Bezos any further than his already obscene wealth and the way he treats his staff is beyond disgusting. Anyway, thank you 🙏🏼.